Overview
Quantiphyse is a visual tool for quantitative analysis of medical images. The aim is to bring advanced analysis tools to users via an easy-to-use interface rather than focusing on the visualisation features themselves.
The software is also designed to support advanced usage via non-GUI batch processing and direct interaction with the Python code.
Quantiphyse works with two types of data:
- 3D / 4D data sets.
- Regions of interest (ROIs). These must be 3D and contain integer data only. Voxels with the value zero are taken to be outside the region of interest, nonzero values are inside. ROIs with more than one nonzero value describe multi-level regions of interest which are handled by some of the tools.
One data set is used as the main data. This defaults to the first 4D data to be loaded, or the first data to be loaded, however you can set any data set to be the main volume. Data which should be treated as an ROI is normally identified when it is loaded (or created by a processing widget), however this can be changed after the data is loaded if it is incorrect.
Data orientation
Quantiphyse keeps all data loaded from files in its original order and orientation.
For display purposes, it takes the following steps to display data consistently:
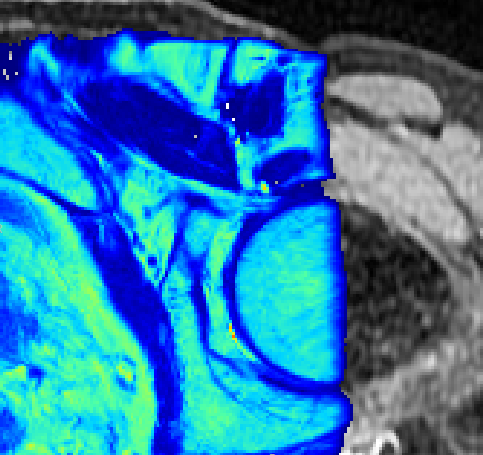
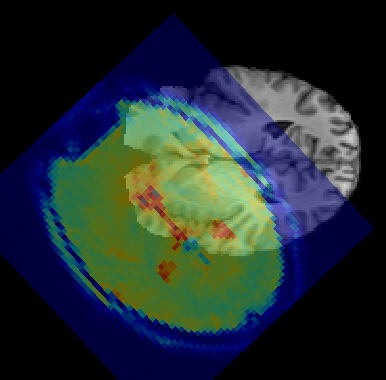
- A display grid is derived from the grid on which the main data is defined. This is done by flipping and transposing axes only so the resulting grid is in approximate RAS orientation. This ensures that the right/left/anterior/posterior/superior/inferior labels are in a consistent location in the viewer. Note that the main data does not need resampling on to the display grid as only transpositions and flips have occured.
- Data which is defined on a different grid will be displayed relative to the display grid. If possible this is done by taking orthogonal slices through the data and applying rotations and translations for display. In this case no resampling is required for display.
- If the data cannot be displayed without taking a non-orthogonal slice, this is done by default using nearest neighbour interpolation. This is fast, and ensures that all displayed voxels represent ‘real’ raw data values. However, display artifacts may be visible where the nearest neighbour changes from one slice to another.
- To avoid this, the viewer options allow for the use of linear interpolation for slicing. This is slightly slower but produces a more natural effect when viewing data items which are not orthogonally oriented.
It is important to reiterate that these steps are done for display only and do not affect the raw data which is always retained.
Analysis processes often require the use of multiple data items all defined on the same grid. When this occurs, typically they will resample all the data onto a single grid (usually the grid on which the main data being analysed is defined).
For example if fitting a model to an ASL dataset using a T1 map defined on a different grid, the T1 would be resampled to the grid of the ASL dataset. Normally this would be done with linear interpolation however cubic resampling is also available. This is the decision of the analysis process. The output data would then typically be defined on the same grid, however again this is the choice of the analysis process.
Special cases
Quantiphyse will try to handle some special cases which would otherwise prevent data being loaded and processed properly.
Multi-volume 2D data
Some data files may be 3 dimensional, but must be interpreted as multiple 2D volumes (e.g. a time
series) rather than a single static 3D volume. When a 3D data set is loaded, an option is available to
interpret the data as 2D multi-volumes. To access this option, click the Advanced checkbox in the
data choice window.
Note
In Nifti files the first 3 dimensions are required to be spatial, so where this occurs with a Nifti file it implies that the file is incorrectly formed and you should ideally correct the acquisition step which produced it.