DCE-MRI Simulation and Analysis
In this tutorial, we will simulate some DCE-MRI data and quantify the simulated parameters using the DCE-MRI analysis pipeline in Quantiphyse.
Simulation
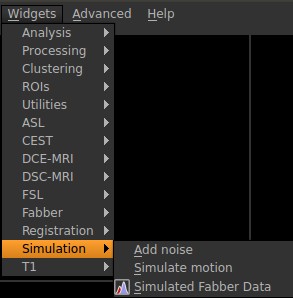
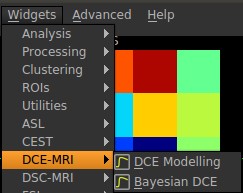
First, launch the widget to simulate DCE-MRI data.
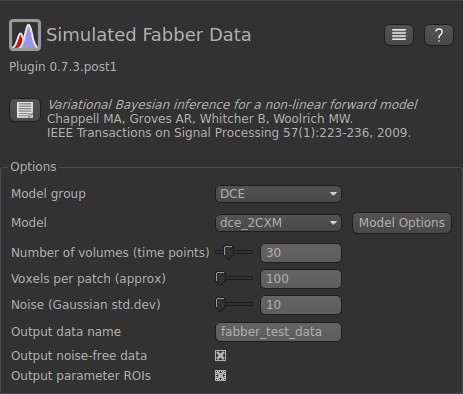
In this example, we will simulate a DCE-MRI data using the two-compartment exchange model (2CXM). First, we specify some basic parameters about the output file. The number of volumes (time points) is related to the total acquisition time and TR. Here we use 30 time points. The voxels per patch indicates the number of voxels (or realizations) to simulate. In this case, we are going to simulate 100 realizations. The noise parameter specifies the noise added to the simulated data. We want to output the noise-free data and parameter ROIs. The setup should look like the following:
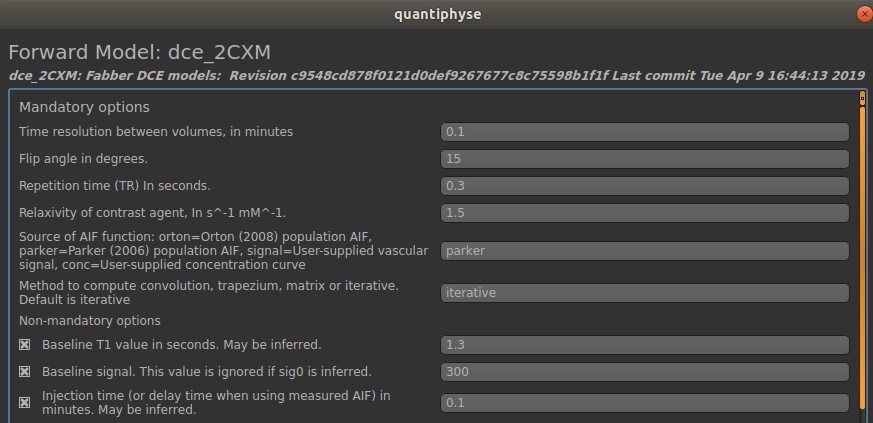
Next click on Model Options as we are going to set up the sequence parameters in the simulation. In the Mandatory options fields, the parameters can take either numerical values or text. The Non-mandatory options can also be modified. It is important to remember these simulated parameter values when we check the quantification results. In this example, we are going to use the following parameter values:
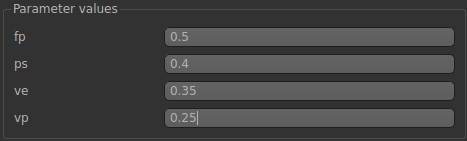
Finally, we are going to specify the hemodynamic parameters. In the 2CXM, there are four hemodynamic parameters: plasma flow (fp), permeability surface area product (ps), volume of extravascular extracellular space (ve), and volume of plasma (vp).
Now click Generate test data.
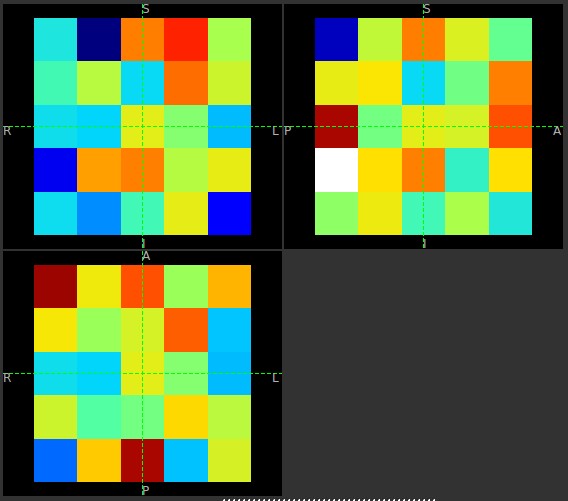
We should be able to see the simulated data shown in the left panel. Your data may be different from the one shown here due to the differences in noise.
Click on Voxel analysis
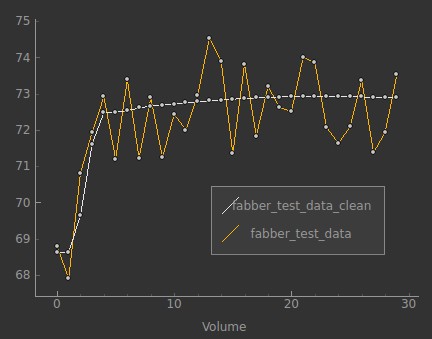
We will be able to see the time series of the noise free (white) and noisy (orange) data in each voxel.
Analysis
In this exercise, we are going to quantify the hemodynamic parameters that we have just simulated. First, bring out the Bayesian DCE-MRI analysis tool.
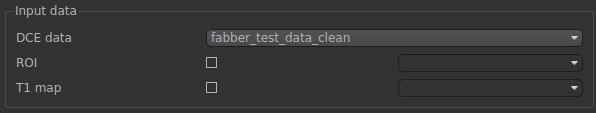
In the input data, we need to select fabber_test_data_clean. This is the noise free data that we have just simulated. Leave the ROI and T1 map empty for now.
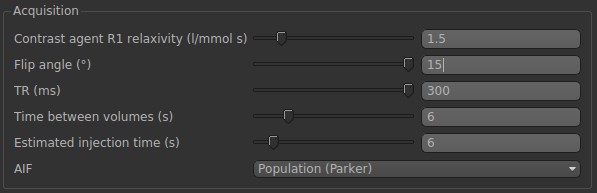
In Acquisition, we need to match these parameters with the ones that we used in the simulation in the following:
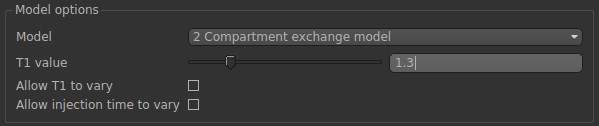
Finally, in Model options, we need to select 2CXM and specify the T1 value (same with simulations).
Now. Click Run.
After the analysis is complete, we will be able to see the results on the left panel.
Try to run the analysis on the noisy data from the simulation (fabber_test_data). After the analysis is complete, use the Data Statistics tool to check the quantification results of each parameter.