 Data Statistics Widget
This widget displays summary statistics for selected data. The mean, median, standard deviation and range are presented.
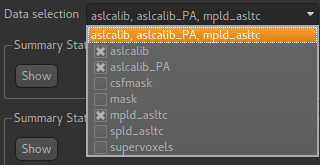
You can select any number of data items and an optional ROI from the menus at the top. Clicking on the menu brings up a list of checkboxes to select the data items you want to include. Clicking outside the menu closes the list.
If an ROI is selected then the summary statistics are presented separately for every region within that ROI:
In this example statistics for two data sets are presented within a single-region ROI:
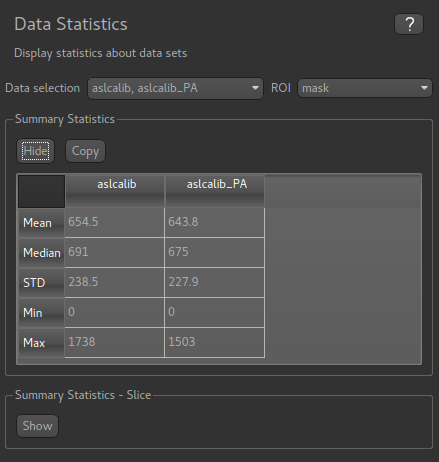
The Copy button for each table copies the data to the clipboard in a tab-separated form which should be
suitable for pasting into spreadsheets such as Excel. In batch mode the Data Statistics process generates
a tab-separated file which can be saved.
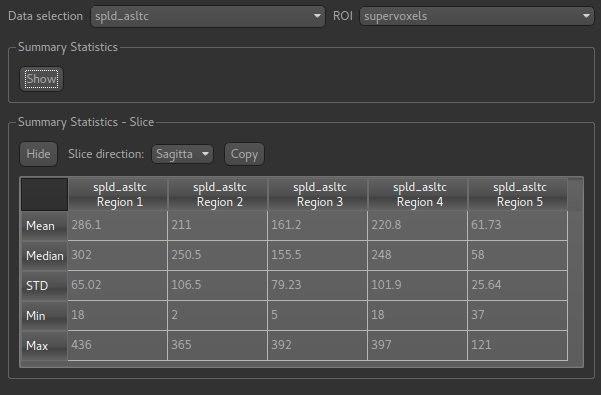
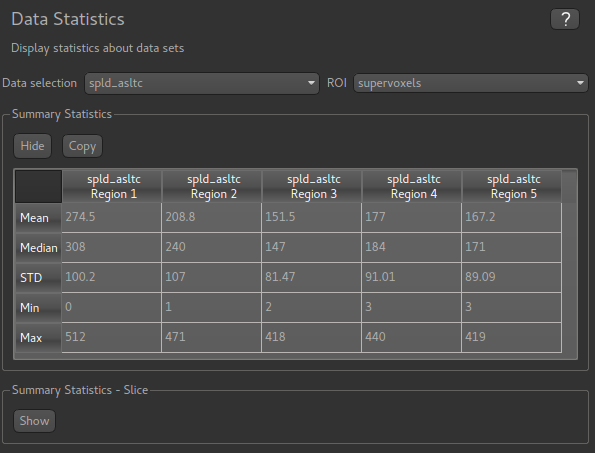
In this example we display statistics for a single data set in each region of a multi-region ROI
(which was generated by the Supervoxels widget):
The Summary Statistics - Slice table can also be displayed - it presents essentially the
same information but over the current slice shown in the viewer (either axial, coronal or sagittal):