Main interface functions
The Main Window
The main window is quite busy, below is an overview of the main functions:
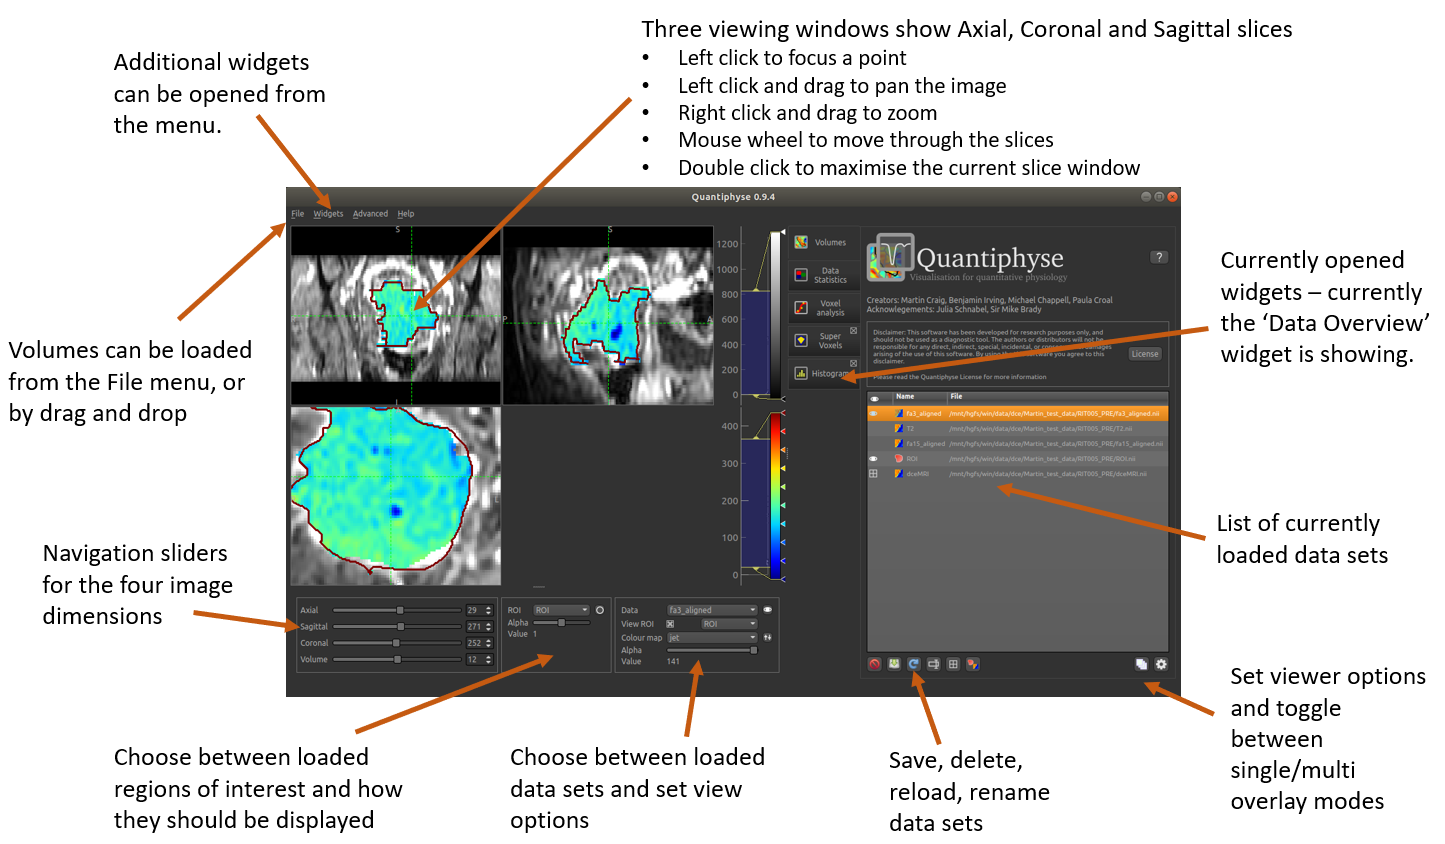
Below we will describe the main functions accessible from the main window.
Loading and Saving Data
File Formats
This software package works with NIFTI volumes. Some builds may contain experimental support for folders of DICOM files, however this is not well tested.
Alternative packages which are able to convert DICOM files to NIFTI include the following:
- itk-snap
- dcm2nii
- Or the batch version which allows a number of volumes to be converted dcm2niibatch
Loading data using Drag and Drop
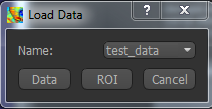
You can drag and drop single or multiple files onto the main window to load data. You will be prompted to choose the type of data:
The suggested name is derived from the file name but is modified to ensure that it is a valid name (data names must be valid Python variable names) and does not clash with any existing data.
If you choose a name which is the same as an existing data set, you will be asked if you wish to overwrite the existing data.
When dropping multiple files you will be asked to choose the type of each one. If you select cancel the data file will not be loaded.
Loading data using the menu
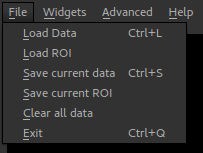
The File -> Load Data menu option can be used to load data files:
You will be prompted to choose the file type (data or ROI) and name in the same was as drag/drop.
Saving Data
The following menu options are used for saving data:
- File -> Save current data
- File -> Save current ROI
So, to save a data set you need to make it the current data, using the Overlay menu or the Volumes widget. Similarly to save an ROI you need to make it the current ROI. Saving the main data can be done by selecting it as the current overlay.
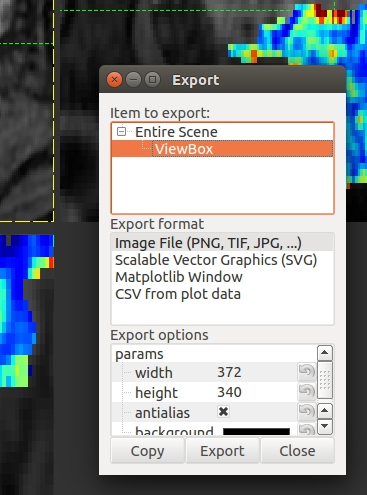
Save a screen shot or plot
- Right click on an image or plot
- Click Export
- A view box will appear with the various format options.
- svg format will allow editing of the layers and nodes in inkscape or another vector graphics viewer.
The Volumes List
After loading data it will appear in a list on the Volumes widget, which is always visible
by default:
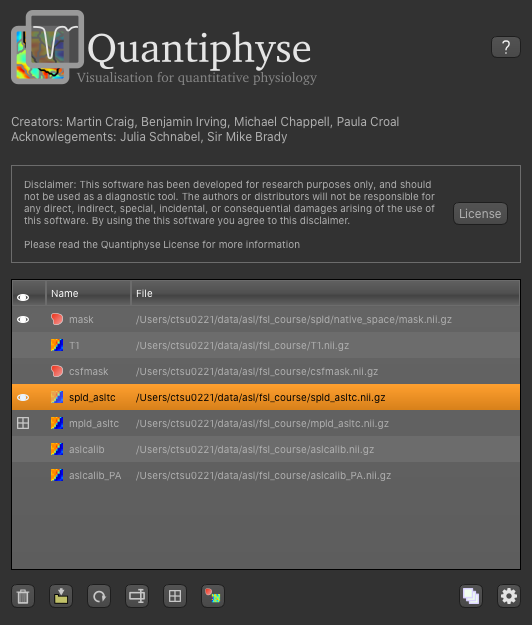
The icon on the left indicates whether the data is visible or not:  indicates that this
is the main data (and will appear as a greyscale background),
indicates that this
is the main data (and will appear as a greyscale background),  indicates that this
data item is visible, either as an ROI or an overlay on top of the background. The icon next
to the data name shows whether it is an
indicates that this
data item is visible, either as an ROI or an overlay on top of the background. The icon next
to the data name shows whether it is an  ROI or a
  data set.
Underneath the volumes list are a set of icons which can be used to modify the currently selected data set:
Delete the selected data set
Save the selected data set to a Nifti file
Reload the selected data set from its source file. This is useful when viewing the results of an analysis done outside Quantiphyse
Rename the selected data set within Quantiphyse. Note that this does not create or rename any files on disk unless you subsequently save the data set
Set this data set to be the main (reference) data set
Toggle between treating this volume as a data set or as an ROI. Note that to set a data set to be an ROI it must be integer only and 3D. This is useful when you accidentally load an ROI as a data set.
In addition the following buttons control the viewer as a whole:
 Toggle between single view mode and multi view mode
By default Quantiphyse starts in single-view mode. In this mode, the main data is displayed as a greyscale background and in addition one ROI and one additional dataset can be overlaid on top. This is a simple and practical way of viewing data that works well in most cases.
However we also support a multi-view mode where any number of data sets can be overlaid on top of the main data. Clicking on the ‘visible’ column for a data set in the list toggles its visibility and data sets higher up in the list overlay those below. In multi-view mode, two additional arrow buttons appear allowing data sets to be moved up and down in the volumes list.
 Change general view options
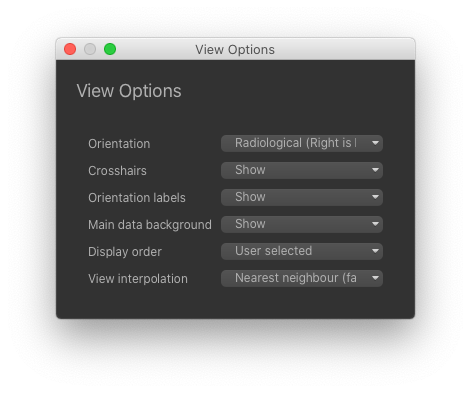
The following options are available for the viewer:
- Orientation: By default Quantiphyse uses the ‘radiological’ view convention where the right hand side of the data is displayed on the left of the screen (as if viewing the patient from the end of the bed). Alternatively the ‘neurological’ convention where patient right is displayed on the right of the screen is also supported.
- Crosshairs showing the currently selected view position may be hidden if desired
- Similarly the view orientation labels (e.g. R/L for right/left) can be shown or hidden
- The greyscale background display of the main data set can be turned on or off
- In single view mode ROIs can be displayed on top of data sets or beneath them. In multi-view mode viewing order is user-specified according to the position of the data in the volumes list
- The interpolation used when non-orthogonal data is displayed can be selected
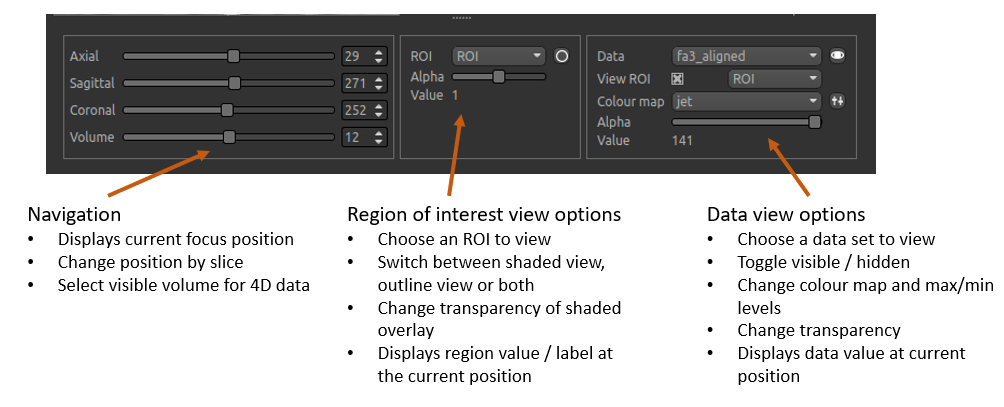
The Navigation Bar
The navigation bar is below the main image viewer and allows the current viewing position, current ROI and current data to be changed:
Using Widgets
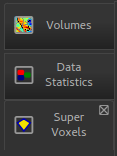
Widgets appear to the right of the viewer window. Most widgets are accessed from the ‘Widgets’ menu above the viewer.
When selected, a widget will appear with a tab to the right of the viewer. You can switch between opened widgets by clicking on the tabs. A widget opened from the menu can be closed by clicking on the X in the top right of its tab.
Widgets may have very different user interfaces depending on what they do, however there are a number of common elements:
 Help button
This opens the online documentation page relevant to the widget. Internet access is required.
 Options button
This shows any extended options the widget may have. It is typically used by widgets which display plots as that limits the space available for options.
 Batch button
This displays the batch code required to perform the widget’s processing, using the currently selected options. This can be useful when building batch files from interactive exploration. It is only supported by widgets which provide image processing functions.
 Citation
Many widgets are based around novel data processing techniques. The citation provides a reference to a published paper which can be used to find out more information about the underlying method. If you publish work using a widget with a citation, you should at the very least reference the paper given.

Clicking on the citation button performs an internet search for the paper.