Arterial Input Function
Widgets -> Utilities -> AIF
The AIF widget is a simple tool for measuring an arterial input signal which is required for modelling imaging techniques based on injection of an arterial tracer agent.
Warning
This tool is marked as Experimental which means that it is still under development
and may not be ready for production use.
Automatic identification of the AIF is not part of the functionality. The widget simply provides a convenient interface to average the signal over a predetermined set of voxels. This set can either be selected by clicking voxels in the viewing window, or by providing an existing region of interest data set.
To define an AIF you must first select a 4D data set containing the measured signal.
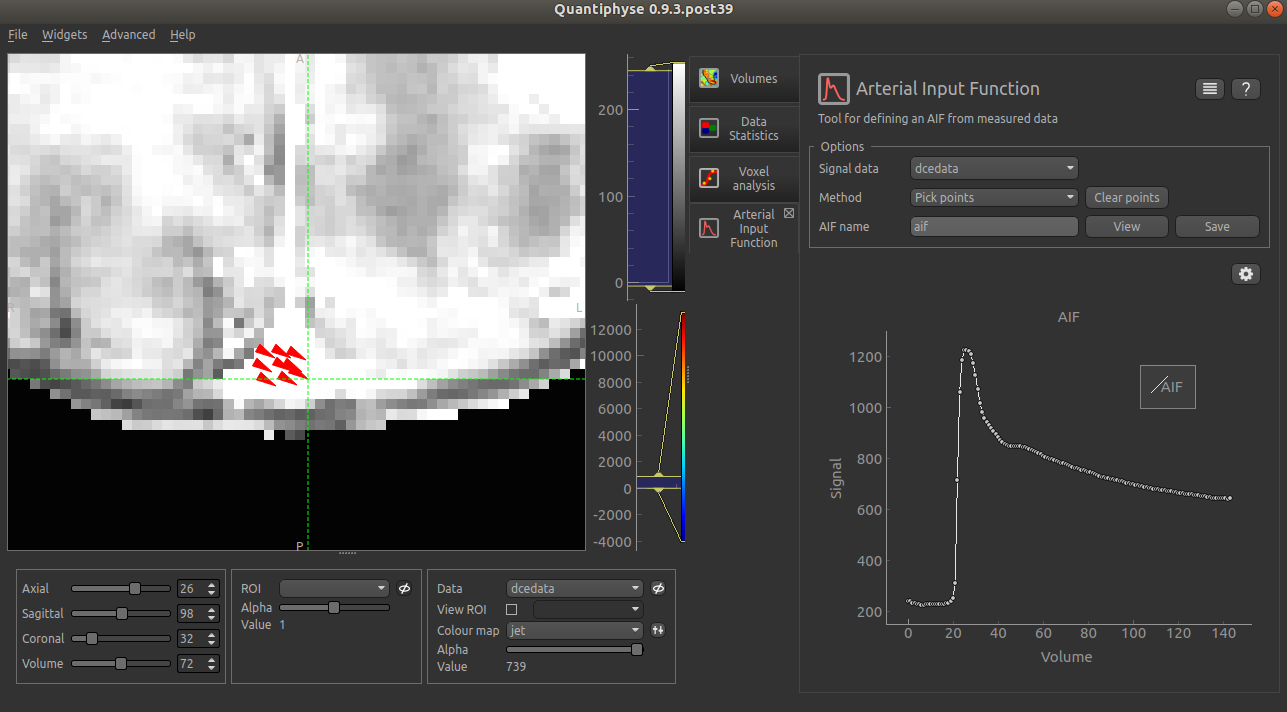
Generating an AIF by picking points
With the Method set to Pick Points, click on voxels in the viewing window to choose
the voxels whose signal will be averaged to form the AIF. Arrows will be placed to indicate the
voxels chosen and the averaged signal will be plotted. This example shows an AIF sampled from
a set of points in the superior sagittal sinus:
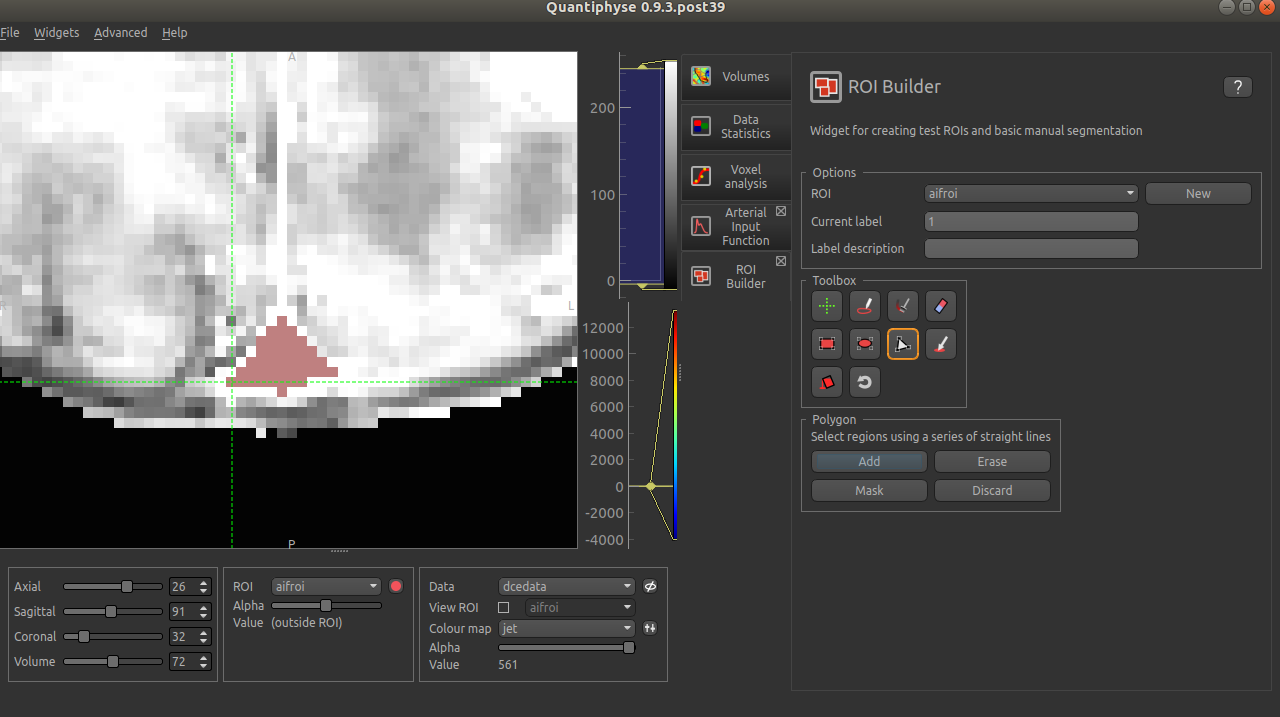
Generating an AIF from an ROI
An alternative approach is to use an ROI to define the set of points over which we sample the AIF. Here we use the ROI builder to define essentially the same part of the image as we used to pick points from:
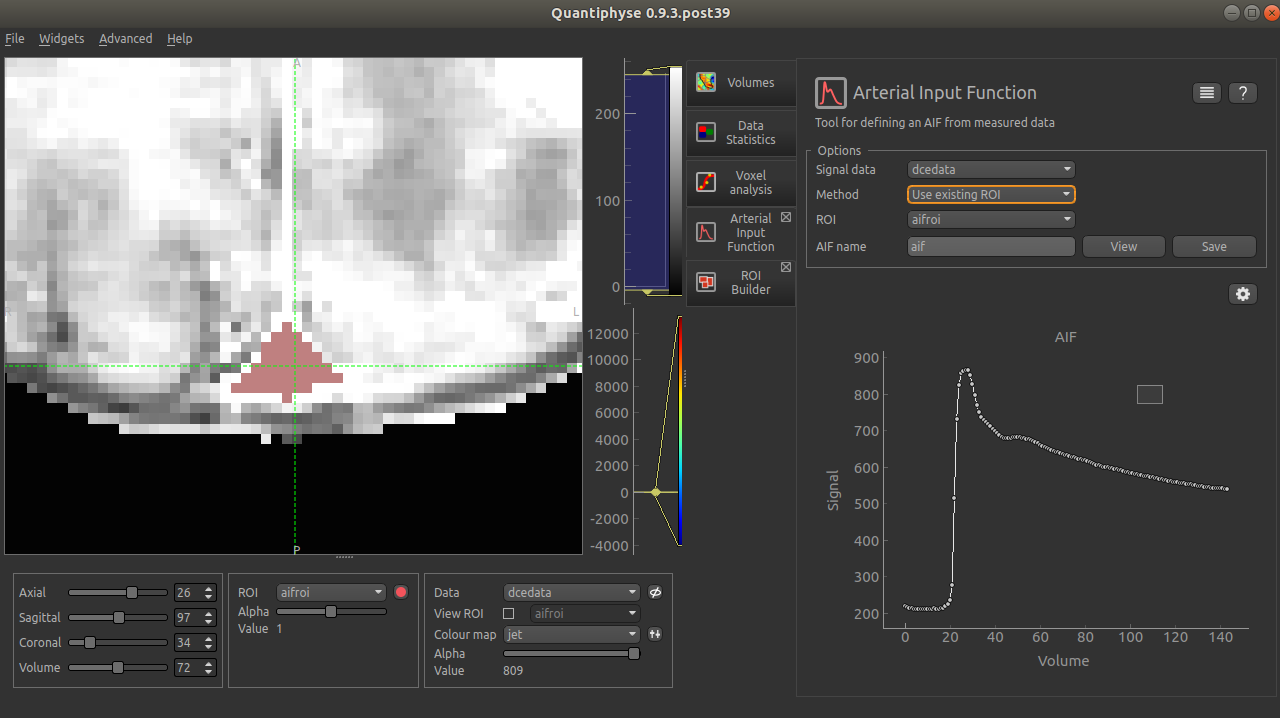
Then with the Method set to Use existing ROI, we select the ROI we just defined to
produce a very similar AIF plot.
Using the AIF
The timeseries values of the AIF can be copied using the View button and subsequently pasted
into any widget which requires an AIF. Note that the widget must be aware that the AIF represents
a signal, and not a tracer concentration value.
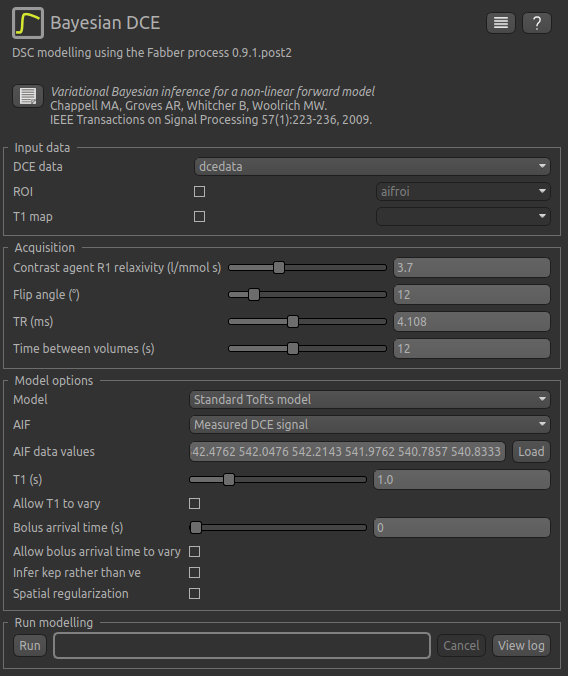
In addition, the AIF can be saved under the specified name using the Save button. Some
widgets support loading a predefined AIF rather than needing to copy/paste the values.