Histogram widget
Widgets -> Visualisation -> Histogram
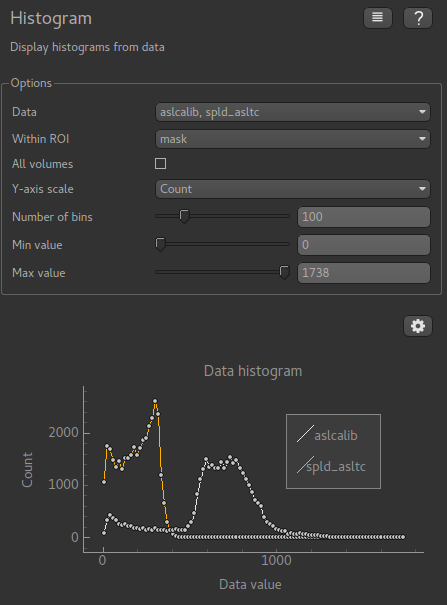
The histogram widget plots a histogram of data values
Any number of data sets can be selected, and the data can be restricted to within a region of interest. Either the frequency or the probability density can be plotted on the Y axis.
The All Volumes option applies to 4D data and selects whether the histogram is taken over
the full 4D data or just the current visible volume.
Example
This example shows a histogram plotted for two data sets within an ROI mask: