Perfusion Simulator
Widgets -> Simulation -> Perfusion Simulator
The perfusion simulator is able to use existing kinetic modelling tools to simulate data for a variety of imaging techniques.
General guide
Generation of simulated perfusion data requires two elements to be chosen - a Structural model and a Data model. The widget has been designed so that new structural and data models can be added easily and combined with each other.
Warning
This tool is marked as Experimental which means that it is still under development
and may not be ready for production use.
The structural model
The purpose of the structural model is to define the different regions / tissue types in which the data is going to be simulated. Each tissue type has its own set of characteristic parameters which affect the generated data (for example cerebral perfusion is likely to be higher in grey matter than in white matter). Each structural model has its own set of options which serve to define these regions.
Partial Volume Maps Structural Model
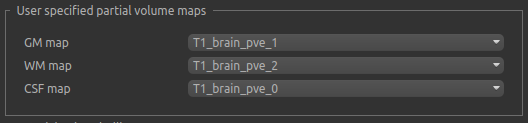
This structural model uses partial volume maps resulting from a brain segmentation performed on a structural image. This would typically define three partial volume maps for grey matter, white matter and CSF. Each would have its own characteristic set of perfusion parameters. By using such a structural model and supplying suitable parameters for each region in the data model (see below), approximations to a real data experiment can be obtained.
This screenshot shows partial volume outputs from a FAST segmentation being used as the structural maps:
Checkerboard structural model
This model is a bit of a special case. In contrast to the partial volume structural model, it is not intended to represent any real physical region. Instead a 2D or 3D data set is defined in which a data model parameter is allowed to vary along each dimension. Clearly this means at most 3 of the data model parameters are allowed to vary. Each 3D co-ordinate therefore identifies a unique combination of data model parameters enabling multiple combinations to be simulated and subsequently fitted. The resulting data set resembles a patchwork or checkerboard, hence the name.
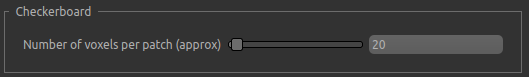
The dimensions of the output image are determined by how many values for each parameter are
given in the data model. However it is common (especially when adding noise to the output)
to allow each patch to contain multiple instances of the same simulation parameters. The
Number of voxels per patch option allows for this:
The data model
The data model defines the type of data which is going to be simulated. Essentially we are choosing a parameterized kinetic model for the experiment and selecting parameter values for each structural region.
The built in data models are derived from the model fitting tools included in Quantiphyse or its plugins. So, we have tools to generate simulated ASL data, DCE data or DSC data.
The options for the simulated data depend on the data model - for example these are the options for ASL data:
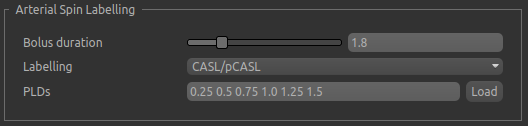
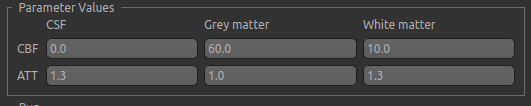
The data model also defines the parameters that may be controlled in the simulated data. For ASL that is currently the perfusion value (CBF) and the arrival time. With a partial volume structural model, one value must be given for each tissue type - here we specify typical perfusion values for WM and GM and an earlier arrival in GM:
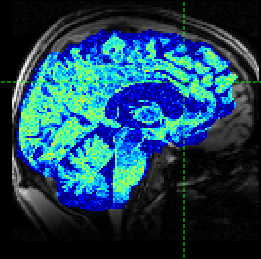
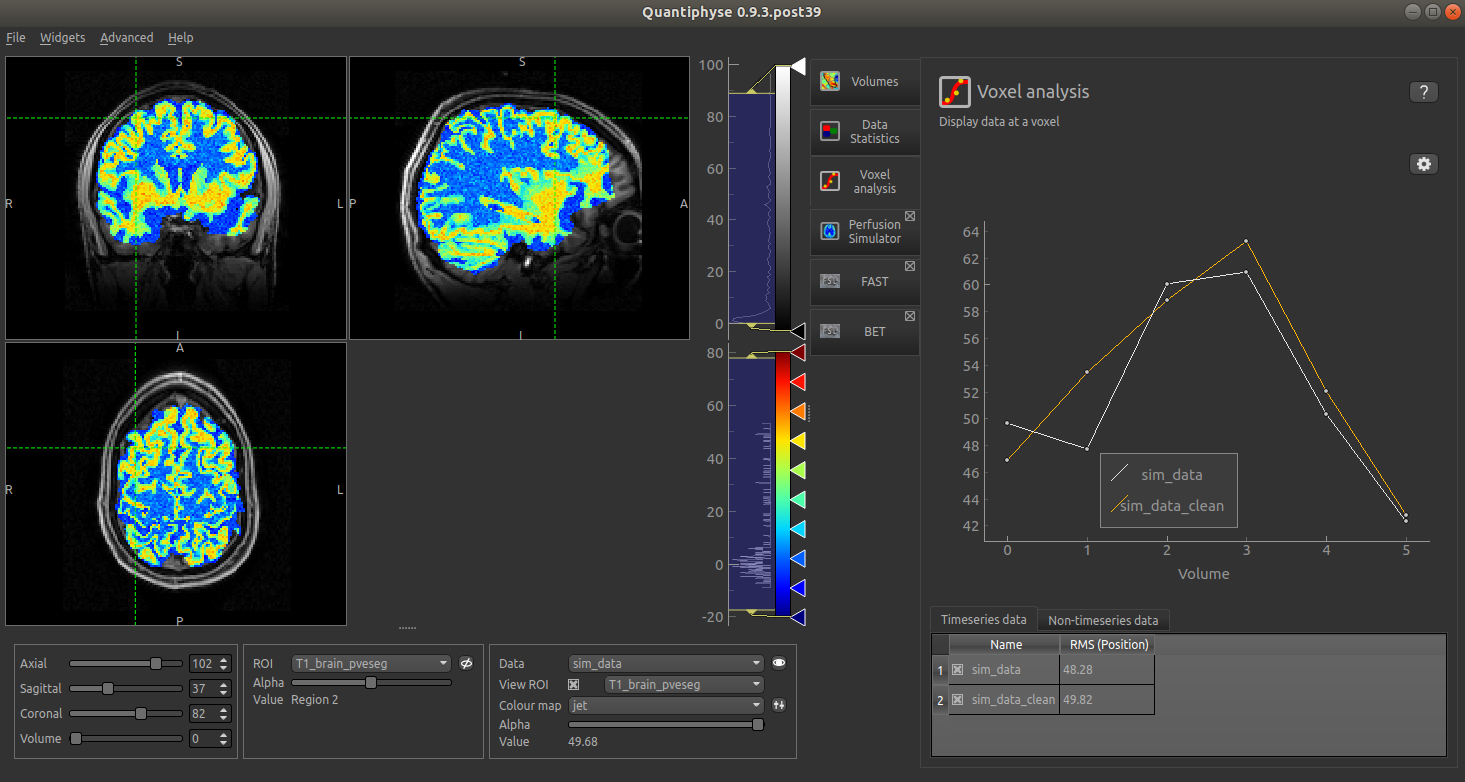
The resulting simulated data is as follows (with added noise):
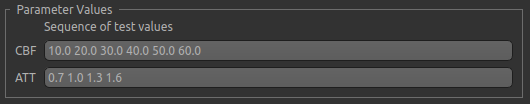
Alternatively, if the ‘Checkerboard’ structural model is used, we have the option of specifying multiple values of each parameter:
The output is as follows:
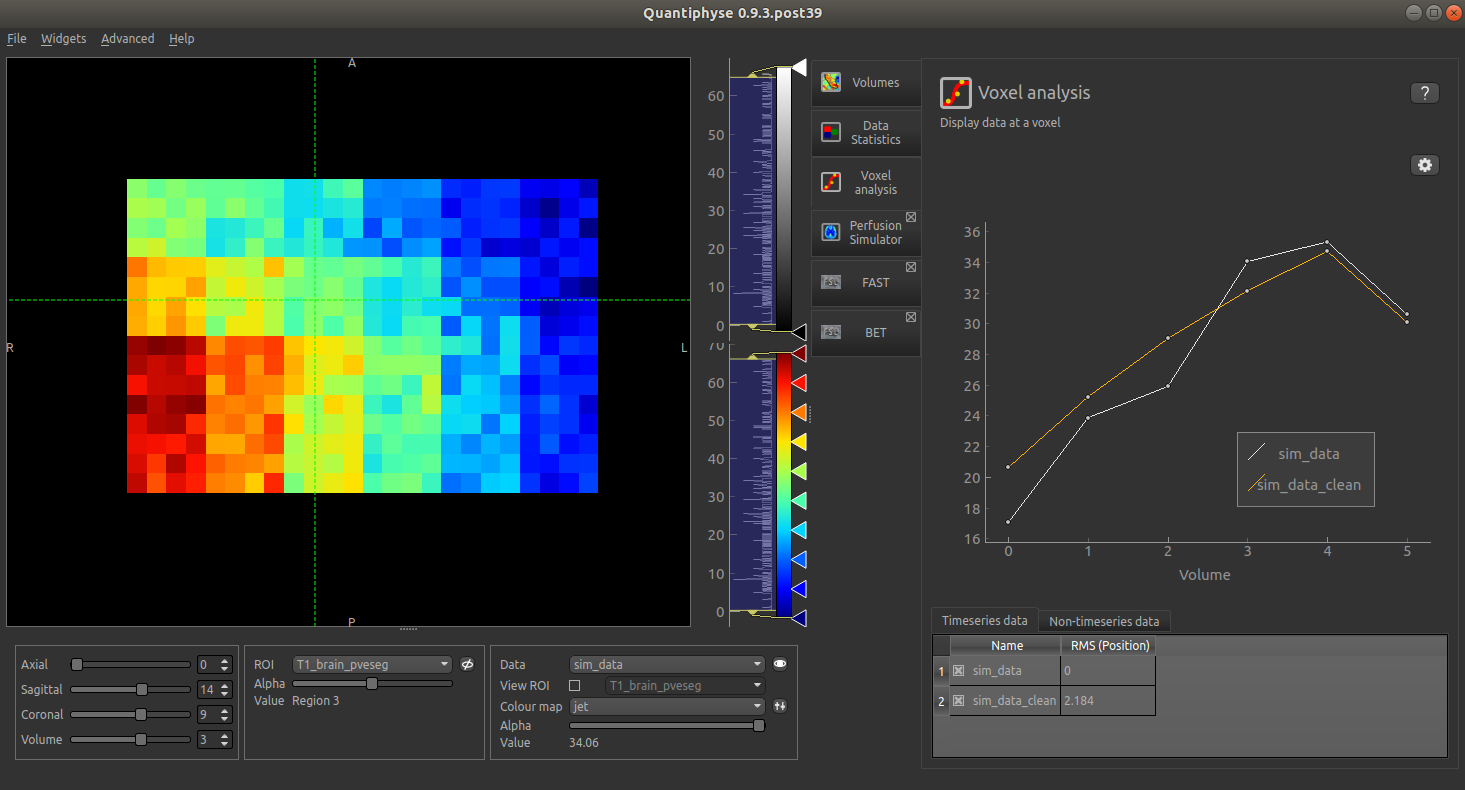
In this screenshot, the simulated CBF value varies horizontally, the arrival time varies vertically.
Generic options
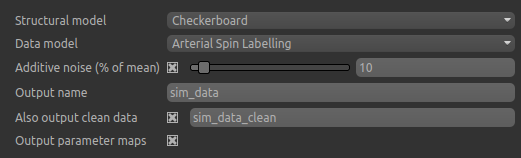
As well as the data and structural model the following options always apply:
Additive noiseis Gaussian noise, specified as a percentage of the mean data valueOutput nameis the name for the main simulated data setAlso output clean datais present when noise is enabled. If enabled, an additional dataset is generated containing the simulated data prior to noise being added.Output parameter mapsif checked causes additional data sets to be generated which contain the parameter values used to generated the simulated data in each voxel. For example in the ASL sample above, datasetsCBFandATTwould be generated. Note that when using the partial volume based structural model the parameter values used in each voxel will be a weighted sum of the user-specified values for each tissue type. In the checkerboard structural model they will directly correspond to the combination of user specified values used in each patch.