K-Means Clustering
Widgets -> Clustering -> KMeans Clustering
Clustering uses the K-Means algorithm to cluster 3D or 4D data into discrete regions.
When used with 4D data, PCA reduction is used to convert the volume sequence into 3D data before K-Means is applied.
Options
- Data set to use for clustering (defaults to current overlay)
- ROI to cluster within (optional, but recommended for most data)
- Name of the output ROI data set
- Number of clusters, i.e. how many subregions the ROI will be split into
- For 4D data, the number of PCA modes to use for reduction to 3D.
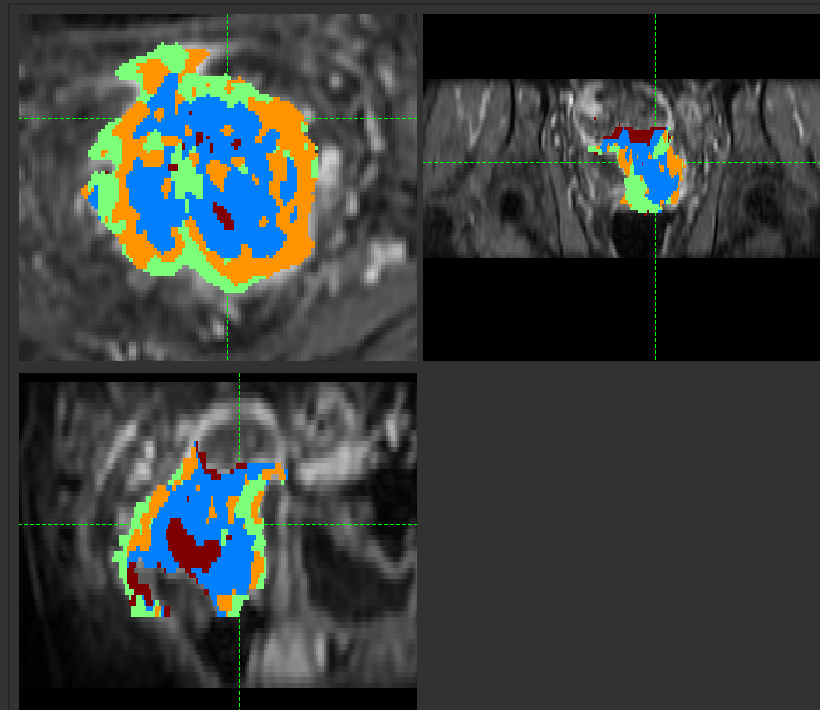
On clicking Run, a new ROI is produced with each cluster assigned to an integer ID.
Show representative curves
This option is available when clustering 4D data, and displays the mean time-series curves for each cluster.
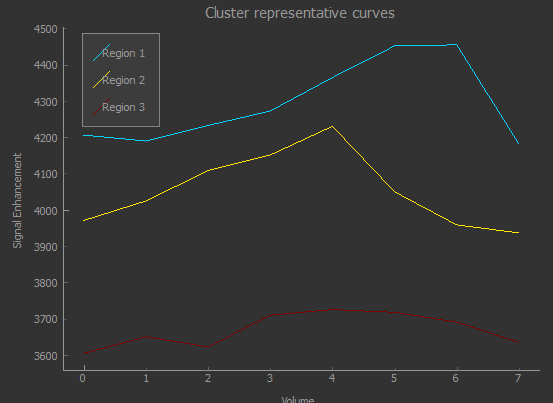
In this case the clusters correspond to two distinct phase offsets of the signal curve, with a third cluster picking up voxels with weak or no signal.
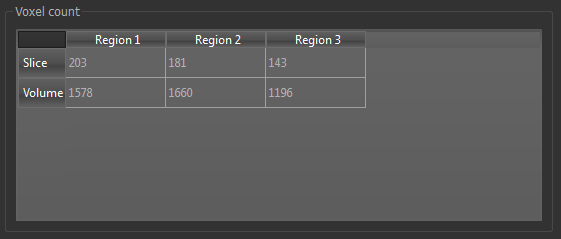
Show voxel counts
This option shows the number of voxels in each cluster, overall and within the current slice.
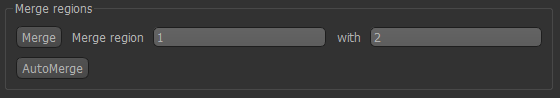
Show merge options
Having generated clusters, it may be desirable to merge some of the subregions - for example if two are
very similar, or one contains very few voxels. The Merge tool allows you to do this by specifying the
two regions to be merged.
An Auto Merge tool is also provided to automatically identify subregions for merging.