Compare data
Widgets -> Analysis -> Compare Data
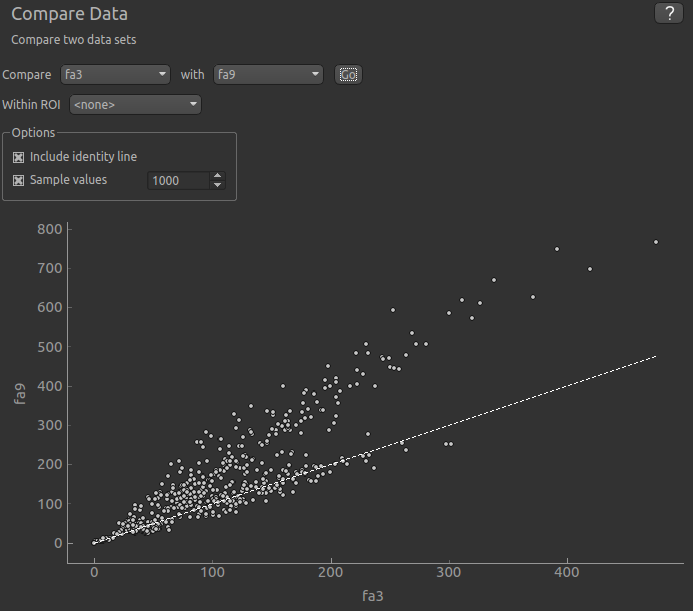
This widget shows a comparison between two data sets. Select the two data sets you are interested in from the menus and
click Go to display a scatter plot of corresponding voxel values.
Options
You can choose to restrict the comparison to voxels within a specfied ROI.
By default only a random sample of 1000 points is displayed. This is because the scatter plot can take a long time to generate otherwise. You can choose the number of points in the sample. If you want to use all values in comparison, turn off the sample, but be aware that the plot may take some time to generate for large or 4D data sets.
An identity line can be shown in cases where you want to compare the data for equality.