Data Statistics
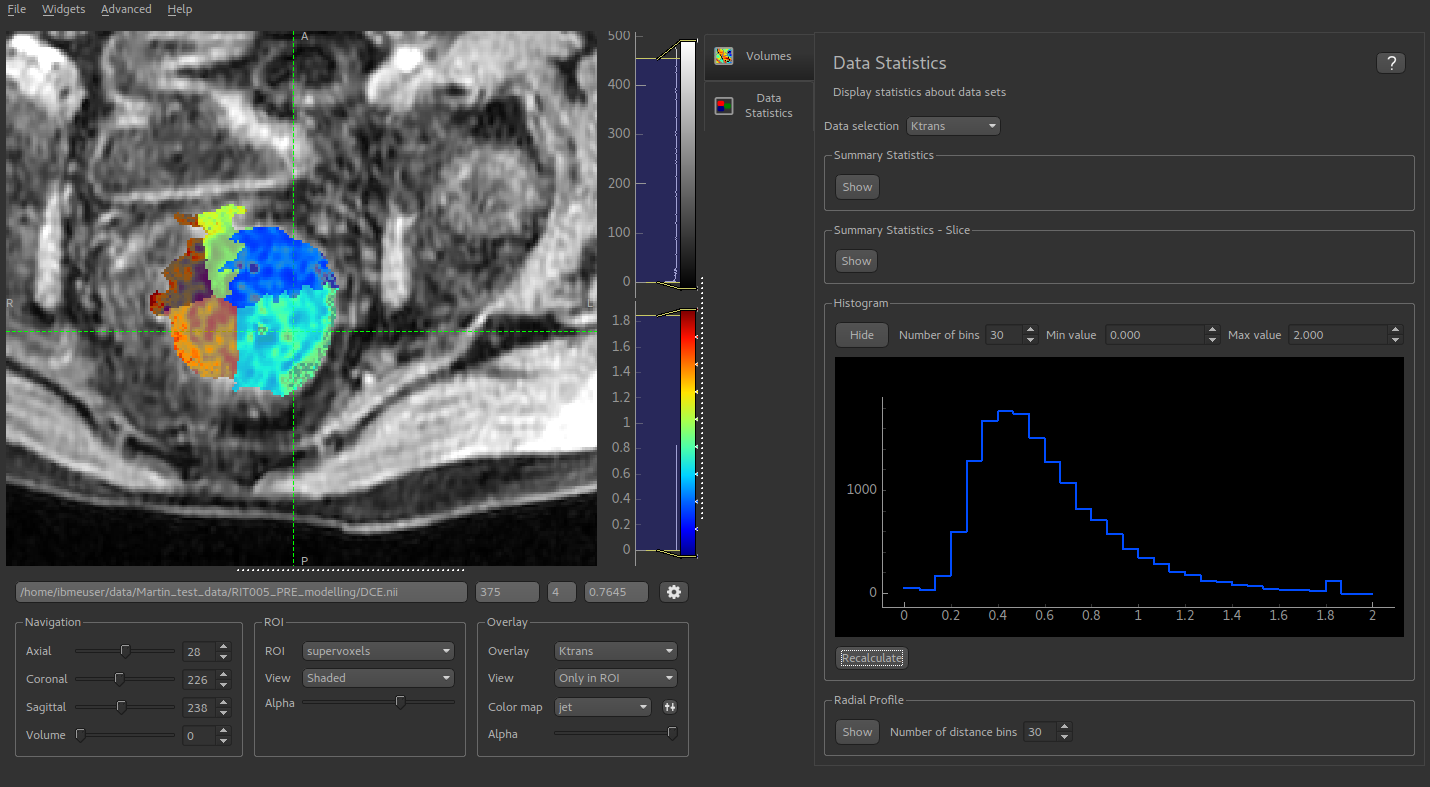
This widget displays data statistics for each region in the current ROI. You can choose to either display statistics for the current data item or for all data items.
The top table displays global statistics across the whole overlay volume - Mean, Median, Variance, Min and Max. The ‘Single Slice’ table shows the same statistics for the current slice in the selected direction.
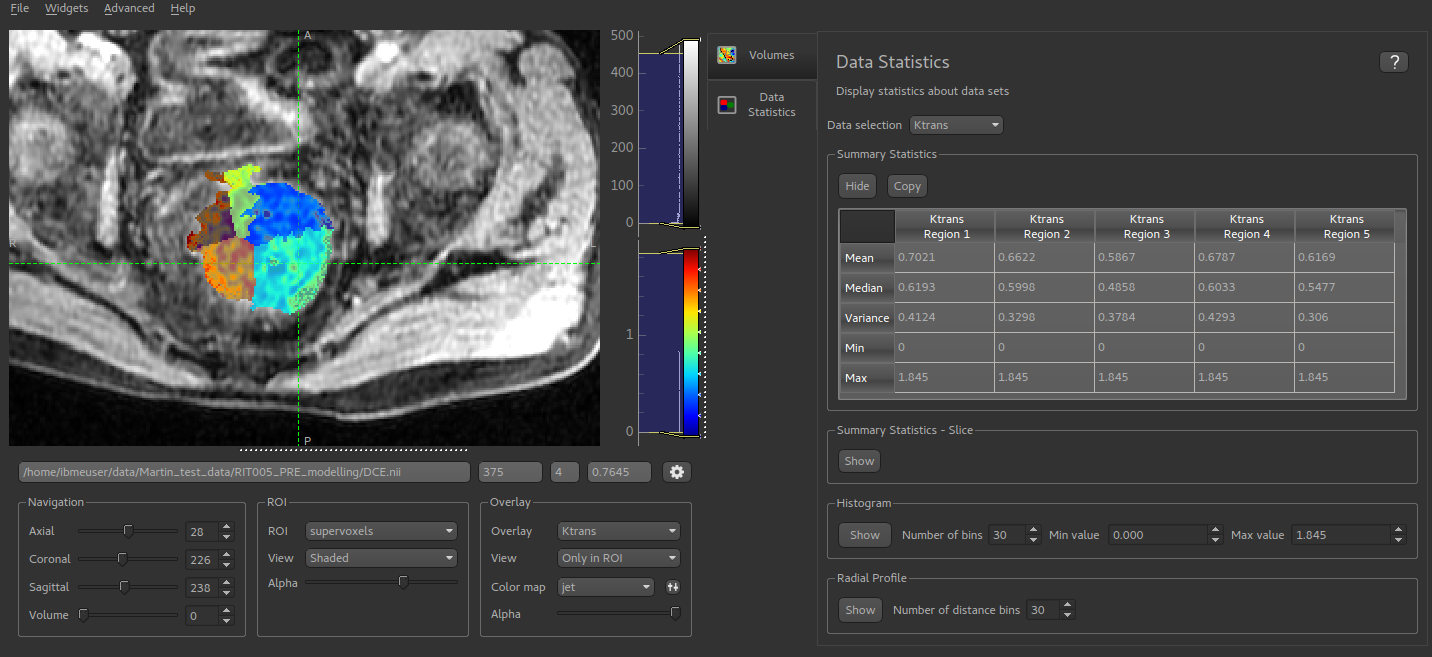
The ‘Copy’ button for each table copies the data to the clipboard in a tab-separated form which should be suitable for pasting into spreadsheets such as Excel.
In addition, a radial profile and histogram can be plotted for the current data item.